
Qlik is a leader in the visual analytics market
Qlik® delivers intuitive platform solutions for self-service data visualization, guided analytics applications, embedded analytics and reporting to approximately 35,000 customers worldwide. Companies of all sizes, across all industries and geographies, use Qlik solutions to visualize and explore information, generate insight and make better decisions. At Qlik, we optimize Business Intelligence (BI) by harnessing the collective intelligence of people across an organization. We focus on empowering people—by enabling everyone in an organization to see the whole story that lives within their data.
On the look-out for a Qlik partner who can help you with:

Qlik Sense Implementation for your organization
Qlik Models and Architecture Optimization
Qlik Training and support for increased adoption across company
Qlik Migration, Embedding Qlik into other applications, and more..
Telling The Whole Story
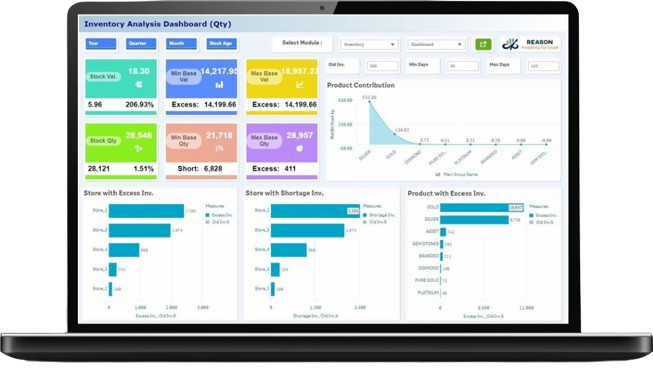
Qlik lets you create visualizations, dashboards, and apps that answer your company’s most important questions. Now you can see the whole story that lives within your data.
WIT is a Qlik Elite Solution Provider, and our team of expert consultants helps our clients unlock their data more effectively with custom data discovery dashboards. Whether they need to be built from the ground up, or you are looking to optimize the performance of your existing environment - we can help you see the whole story your data has to tell.
What Makes Qlik Unique
What Makes Qlik Unique
Qlik has a unique point-and-click interface that provides answers to your direct questions at the speed of thought. But Qlik also provides insights into questions that you didn’t ask. For example, imagine you want to see product category sales by sales rep. In a single click or two, Qlik will show you the list of product categories sold by each sales rep. With Qlik’s patented query engine, Qlik will automatically display the inverse question that you didn’t ask: show me the product categories that were not sold by each sales rep. This capability allows you to see the entire scope of analysis, and lets you see the whole story in your data.
Big data handling
Most data analysts are stuck with Excel as their primary data analysis tool. But handling more than 100,000 rows of data can be frustratingly slow, and handling more than 1,000,000 rows is really not possible. With Qlik’s patented database technology, not only can you process millions of rows, but you can expect results in sub-second response time. No other data visualization tool handles big data this fast. And data from multiple sources? No problem – Qlik is the leader in merging disparate data sources into a single dashboard view.
Self-Service and World-Class Dashboards
Some data visualization tools are designed for self-service – allowing end users to build dashboards without IT. And some data visualization tools are designed to enable development of complex dashboard that require developer skills. Qlik is the only product in the marketplace that provides both!
Qlik Analytics Platform
The Qlik Analytics Platform (QAP) is a new package from Qlik that gives developers and OEM’s the ability to embed Qlik’s visual analytics capabilities into any application through web mashups or by embedding into custom applications. It includes the same core QIX analytics engine that Qlik Sense is built on and the full suite of product API’s.
Value Added Product
GEOANALYTICS
Advanced multi-layer mapping and geographic calculation, analysis, and lookup geocoding for Qlik Sense and QlikView.

NPRINTING 17
Develop great looking reports from Qlik Sense and QlikView and get the right reports to the right people, how and when they need them.

CONNECTORS
Provides real-time connectivity that gives you the ability to rapidly add and access data sources using pre-configured connectors.

QLIK SENSE CLOUD BUSINESS
Group level management and collaboration that allows public and private app sharing with anyone, anywhere, on any device.
BI/Analytics Definitions
WHAT IS BUSINESS INTELLIGENCE?
Business Intelligence (BI) is an umbrella term that includes the applications, infrastructure and tools, and best practices that enable access to and analysis of information to improve and optimize decisions and performance. BI technologies provide historical, current and predictive views of business operations. Common functions of business intelligence technologies include reporting, online analytical processing, analytics, data mining, process mining, complex event processing, business performance management, bench-marking, text mining, predictive analytics and prescriptive analytics.
WHAT ARE DASHBOARDS?
Dashboards are a reporting mechanism that aggregate and display metrics and key performance indicators (KPIs), enabling them to be examined at a glance by all manner of users before further exploration via additional business intelligence (BI) tools.
WHAT IS A DATA WAREHOUSE?
A data warehouse is a storage architecture designed to hold data extracted from transaction systems, operational data stores and external sources. The warehouse then combines that data in an aggregate, summary form suitable for enterprise-wide data analysis and reporting for predefined business needs.
WHAT IS DATA GOVERNANCE?
Data governance is the management of all an organizations data to ensure that high data quality exists throughout the complete life-cycle of the data. The key focus areas of data governance include availability, usability, consistency, data integrity, and data security.
WHAT IS DATA PROFILING?
Data profiling is a technology for discovering and investigating data quality issues, such as duplication, lack of consistency, and lack of accuracy and completeness. This is accomplished by analyzing one or multiple data sources and collecting metadata that shows the condition of the data and enables the data steward to investigate the origin of data errors.
WHAT IS EMBEDDED ANALYTICS?
Embedded analytics is the use of reporting and analytic capabilities in transactional business applications. These capabilities can reside outside the application, reusing the analytic infrastructure built by many enterprises, but must be easily accessible from inside the application, without forcing users to switch between systems.
WHAT IS BIG DATA?
Big data is high-volume, high-velocity and/or high-variety information assets that demand cost-effective, innovative forms of information processing that enable enhanced insight, decision making, and process automation.
Learn more about business intelligence and industry trends by downloading Qlik's "6 Trends to Look for in BI" E-book. Check out this E-book to learn:
- Why big data is becoming less of a big deal
- What the rise of information activism means for you
- Why governance is the secret ingredient to BI success